
我把Udacity 裡面的Model都放在 TFC GitHub
這裡整理一些TFC考試應該會用到的cmd
python基本cmd上大致上會用到的都是處理data要用到的function
#enumerate, 把list變成 index, value
for idx, value in enumerate(celsius_q):
    print("index {} value {}".format(index, value)

#把資料夾該層底下的檔案印出來 (不包含更下層)
os.listdir()

#印出該路徑的資料夾名稱
os.path.dirname()

#解壓縮
zip_ref = zipfile.ZipFile(local_zip, 'r')
zip_ref.extractall('/tmp/training')
zip_ref.close()

#lambda 一行可以定義完的function
lambda arg1, arg2: condition

#csv reader
#next是跳過一行
with open('Sunspots.csv') as csvfile:
    reader = csv.reader(csvfile, delimiter=',')
    next(reader) # skip first line
    for row in reader:
        sunspots.append(float(row[2]))
        time_step.append(int(row[0]))
雖然tensorflow都是numpy input, 但是當初練習的時候都是使用tensor在做處理
(這好像也算是當初2.0主推的功能eager mode, 可以不用定義圖, 直接對想處理的數據做張量運算)
所以numpy的部分吃重就變少了
#將list變成numpy
#array和asarray都可以將結構數據轉化為ndarray,
#但是主要區別就是當數據源是ndarray時,array仍然會copy出一個副本,佔用新的內存,但asarray不會。
np.array(alist, dtype=float)

#根據條件篩選numpy
np.where(condition, x, y)

#np.arange 與np.range不同的是支援小數step
np.arange(0, 1, 0.01)

#np.reshape, 可以變更numpy的結構形狀排法
#尤其是圖形最需要轉換
#黑白圖形的最後一個channel就需要靠下面這種方式產生
training_images = training_images.reshape(training_images.shape[0], training_images.shape[1], training_images[2], 1)
matplot對於分析很有幫助, 對於建立model沒有直接的幫助, 但當model train不起來或是效能不佳的時候很需要用到, 或者以後展現成果的時候很需要用到
這邊既然看到了就稍微研究一下
import matplotlib.pyplot as plt
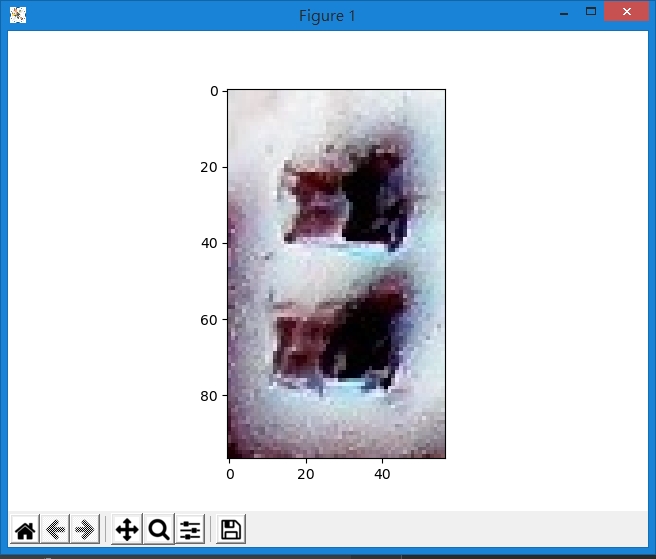
#最簡單的畫圖方式, 直接把圖片展示出來
plt.imshow(training_images[0])
plt.show()
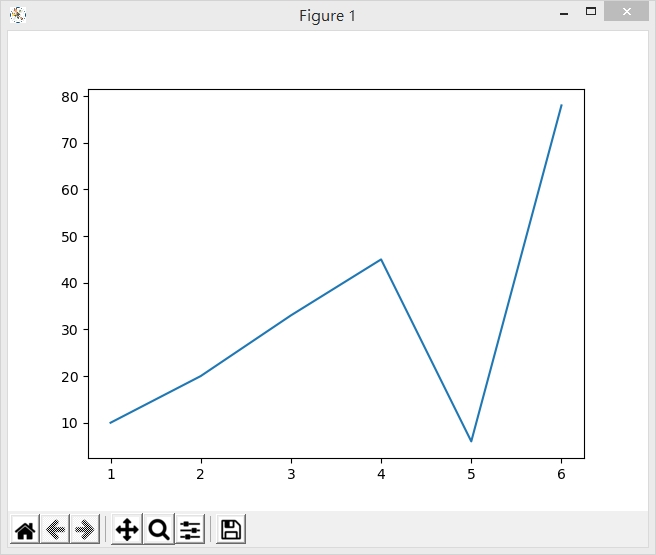
#劃一條線
plt.plot(x, y)
plt.show()
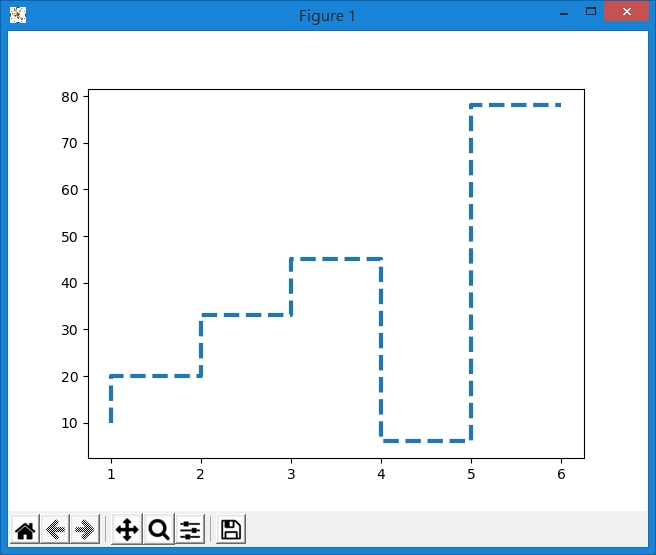
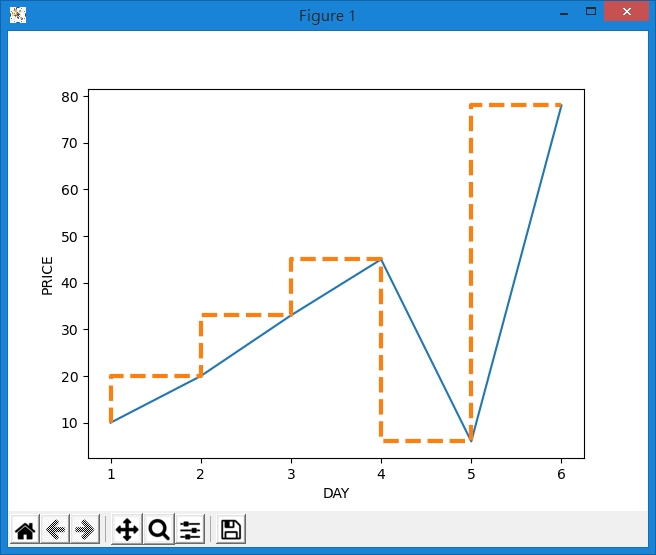
#可以指定drawstyle, fillstyle, linestyle
#drawstyle指的是點與點之間的連接畫線要用甚麼形式, default是點與點連接, step是變成階梯狀連接
#filltyle指的是點的填充方式, 預設是全填滿, 有left, right, bottom, top, none可以選擇
#如果要改變marker的形狀就要另外參考marker
#linestype指的是線要需線或實線, 有實線'-', 虛線'--', 虛點線'-.', 點線':', 不畫線''
#linewidth線寬
plt.plot(x, y, ds="steps", ls="--", lw=3, fillstyle='left')
#style也可以直接組合變成
plt.plot(x, y, "ro") #red 點
plt.plot(x, y, "r--") #red 虛線
#變更x, ylabel, 坐標軸的title
plt.xlabel("DAY")
plt.ylabel("PRICE")

畫多條線有很多種方法, 但我認為只須要先熟悉用一種就好
#畫多條線
plt.plot(x1, y1)
plt.plot(x2, y2)
接下來是各種圖式, 這個建議直接上matplotlib的官網找自己想畫的種類就好
#長條圖
plt.bar(x, y)
#scatter
plt.scatter(x, y)
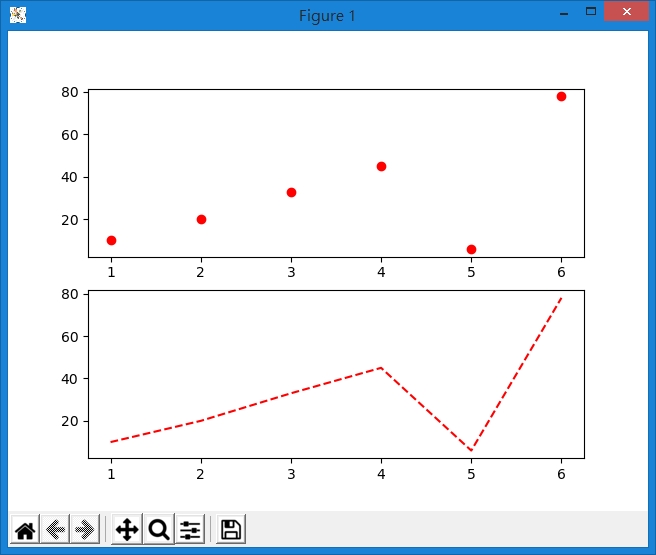
這邊畫多張圖, 也有很多種方式, 一樣先學一種, 等到遇到困難再學其他種,
有一點要注意的是每次的label跟style在每次切換subplot都要重新設定
#想畫多張圖
#211 第一個數字代表的是rows, 第二個代表的是columns, 第三個代表的是在這裏面的第幾個位置
plt.subplot(211)
plt.plot(x1, y1)
plt.subplot(212)
plt.plot(x2, y2)
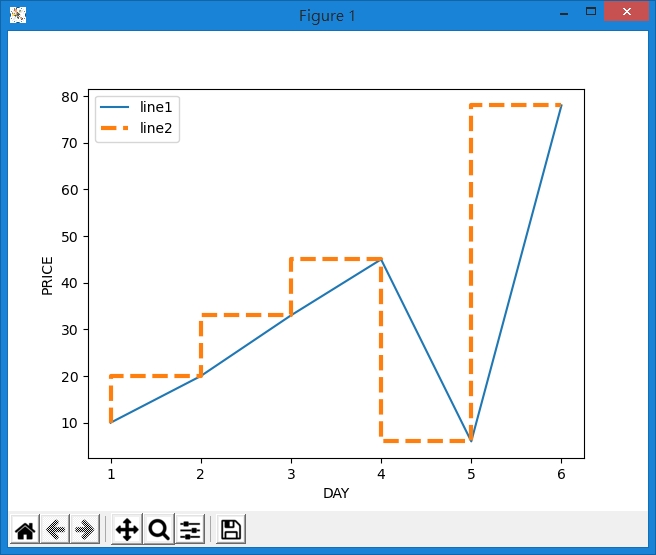
#增加線的標註
#利用p1, p2物件, 送進去legend裡面, 並且指定名稱
p1, = plt.plot(x, y, ls="-")
p2, = plt.plot(x, y, ds="steps", ls="--", lw=3, fillstyle='left')
plt.legend([p1, p2], ["line 2", "line 1"], loc='upper left')

#或是採用label的方式標註名字
#後面再透過legend trigger
plt.plot(x, y, ls="-", label="line1")
plt.plot(x, y, ds="steps", ls="--", lw=3, fillstyle='left', label="line2")
plt.legend()
plt.xlim(xstart, xend) #設定x座標範圍
plt.ylim(xstart, yend) #設定y座標範圍
下一篇開始會介紹針對TF certification的model會怎麼建立


